









Calculating a Website’s GHG Footprint: Why and How Can Companies Take Action?

Saviez-vous qu’un simple site web, pourtant outil clé du numérique, peut avoir un impact carbone considérable ? Alors que le numérique est souvent perçu comme “immatériel”, il représente déjà près de 4% des émissions mondiales de CO₂. Cette réalité, souvent sous-estimée, s’accentue avec la multiplication des sites et des usages digitaux. Les sites web ne sont d’ailleurs pas les seuls concernés : l’empreinte carbone des mails est elle aussi largement sous-estimée.
Every website—whether through its infrastructure, traffic, or maintenance—consumes resources and produces CO₂ emissions.
The challenge is clear: to reduce the carbon footprint of digital activities while meeting stakeholder expectations and optimizing performance. To achieve this, it is essential to start by measuring your website’s GHG footprint.
Why and how can companies take action to limit this growing impact?
Why calculate a website's GHG footprint?
🌎 Understanding Your Environmental Impact
Data centers, the backbone of website hosting, are major energy consumers, which are often powered by non-renewable sources. The high demand for them in terms of capacity This makes it a major challenge in reducing the digital carbon footprint. This high energy consumption stems from several sources:- Data centersaccount for 1.5% of global energy consumption. Butthe International Energy Agency (IEA) warns that this share could rise to 10% by 2030 if no significant action is taken.
- The networks required for data transfer are powered by energy-intensive infrastructure
- User devices, such as smartphones and computers, also use electricity.
✅Meet stakeholders' expectations
As environmental awareness continues to grow, customers and partners are increasingly concerned about companies’ digital footprint and are demanding concrete actions to reduce their environmental impact. In fact,“9 out of 10 French consumers expect companies to address social and environmental issues,” according to the Senate.
Furthermore, adopting a CSR approach by conducting a website’s GHG assessment is an opportunity for a company to demonstrate its environmental commitment, while meeting stakeholder expectations and gaining credibility with an environmentally conscious audience.
A joint study by Razorfish, Publicis’s digital agency, and the GreenIT collective examined the environmental impact of the 90 most iconic websites in the French economy, including those of CAC 40 companies (major e-commerce platforms, media outlets, and public services).
The results are unequivocal and reveal an alarming impact:
🔺Every year, French websites emit 7 million kilograms of CO2 equivalent—the equivalent of 1,007 trips around the world [1]
🔺 These digital portals consume 106 million liters of water, which is equivalent to the average annual water consumption of one French person over… 1,983 years [2]
[1] Based on an average distance traveled of 45 million km for 7.6 million keqCO₂ emitted.
[2] Based on an average of 146 liters of water consumed per day, according to the per capita daily drinking water consumption figures for 2016 published by Eau France in 2020.
📈 Optimize Performance
This dramatic increase in the importance of digital interfaces—which grew 155-fold between 1995 and 2022, according to EcoIndex, illustrates the urgent need to rethink website design and management. In this context, website optimization becomes a key driver, offering benefits not only for the environment but also for companies’ economic performance:- Reduced storage costs due to a lower volume of data.
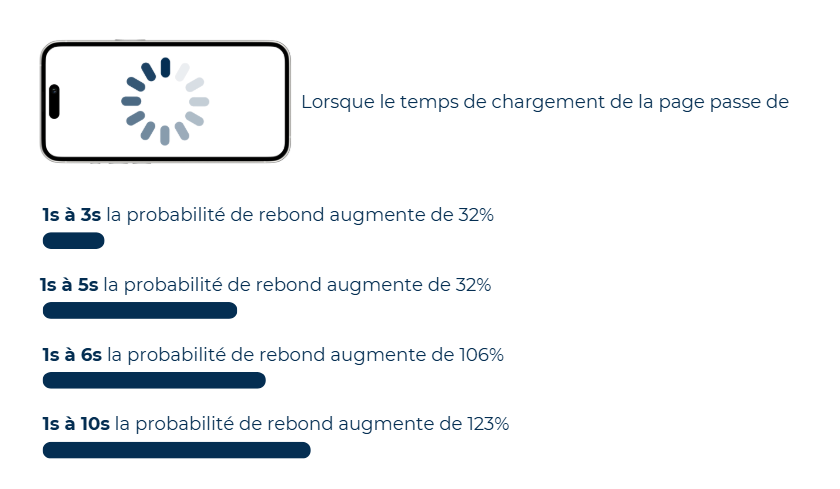
- Improved user experience: A lighter interface loads faster, which reduces the bounce rate. It’s worth noting that “the average mobile page load time is 22 seconds. However, 1 in 2 visits is abandoned if a mobile site takes more than 3 seconds to load,” according to a marketing study conducted by Google.
Correlation Between the Transfer Time of a Digital Interface and the Bounce Rate
- Better SEO performance: Search engines prioritize fast, well-optimized websites, increasing their visibility and appeal.
- Reducing your carbon footprint: By reducing the size of your digital interface, you limit the use of non-renewable energy—which is associated with computer systems and data transfers—thereby contributing to a more sustainable digital future.
What are the main categories of content on a website?
♨️ Hosting and Servers
The data centers are a major source of carbon emissions. In 2022, global energy consumption by these hosting providers amounted to 460 terawatt-hours (TWh) electricity, according to Franceinfo. The key factors are:- Energy source used: Data centers powered by fossil fuels emit far more emissions than those using renewable energy sources.
- Data volume: A large website (in terms of the number of pages and large files) consumes a significant amount of energy to store and serve.
- Distance between computer systems: Data transfers over long distances consume more energy.
💡 Structure and Content
The way a website is designed directly affects its carbon footprint.
- Large files: Uncompressed images and autoplay videos slow down digital interfaces.
- Unoptimized code: Inefficient code places a greater burden on IT systems, slows down the website, and increases its carbon footprint.
- Unnecessary plugins: Non-essential features slow down the site.
📲 Traffic and Usage
A website’s energy consumption is directly linked to its traffic and how visitors use it. Each visitor triggers a series of actions (such as loading a page or transferring information) that consume energy. The longer and more frequent the sessions, the more CO₂ the site emits.- Number of visits and session duration: An increase in the frequency and duration of sessions significantly increases energy consumption.
- User Location: Users who are geographically distant from IT systems increase the demand for data transfer.
📛 Maintenance and Updates
Even when running in the background, website maintenance results in ongoing energy consumption:- Frequent updates: They place repeated demands on computer systems.
- Unnecessary backups: Outdated data or unnecessary versions take up storage space.
How can you reduce a website's carbon footprint?
Every click, every visit, and every file uploaded to a website comes with an energy cost that is often invisible but very real. However, solutions exist to reduce this impact while improving the site's performance.
Here are some practical steps you can take to make your website an effective and eco-friendly tool:
💯Technical Optimization
- Compress and Optimize Media
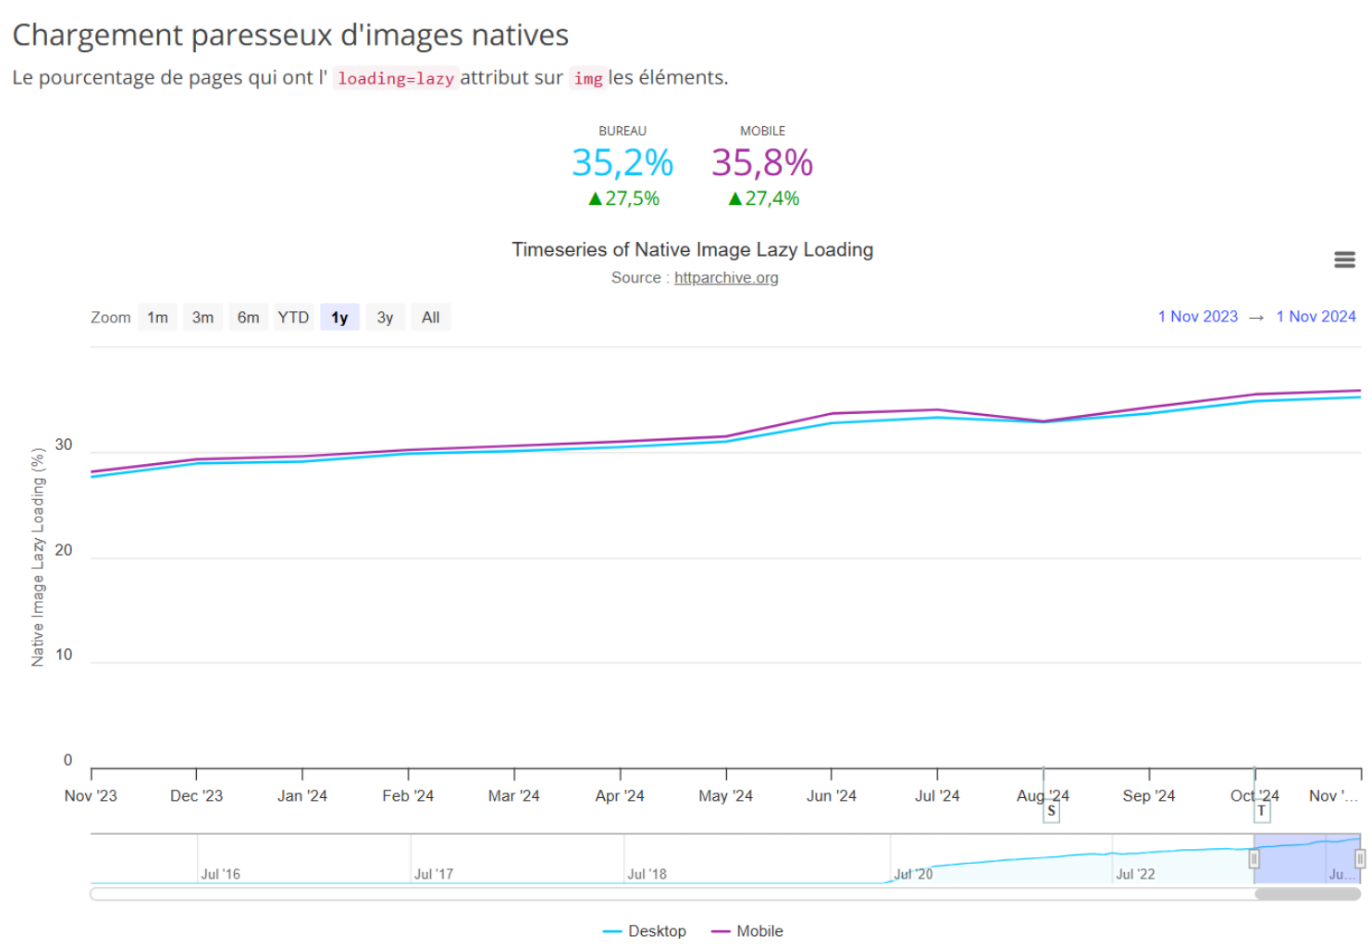
Image optimization is essential for reducing the size of a digital interface while saving bandwidth and improving load times. Lazy loading of a page is a complementary solution that delays the display of images until they appear on the screen.
This allows you to:
- Reducing the amount of energy consumed during data transfer.
- Improving website performance for the end user.
According to the chart, more than 35% of pages already use this technique, which has seen strong growth over the past year (+27%) for a given period [3]
However, to maximize these gains, it’s crucial to take compression a step further .
[3] Period: November 1, 2023 – November 1, 2024
- Streamline the code: Using optimized code (HTML, CSS, JavaScript) can reduce a page’s total size. This reduces the amount of energy required to process requests on computer systems.
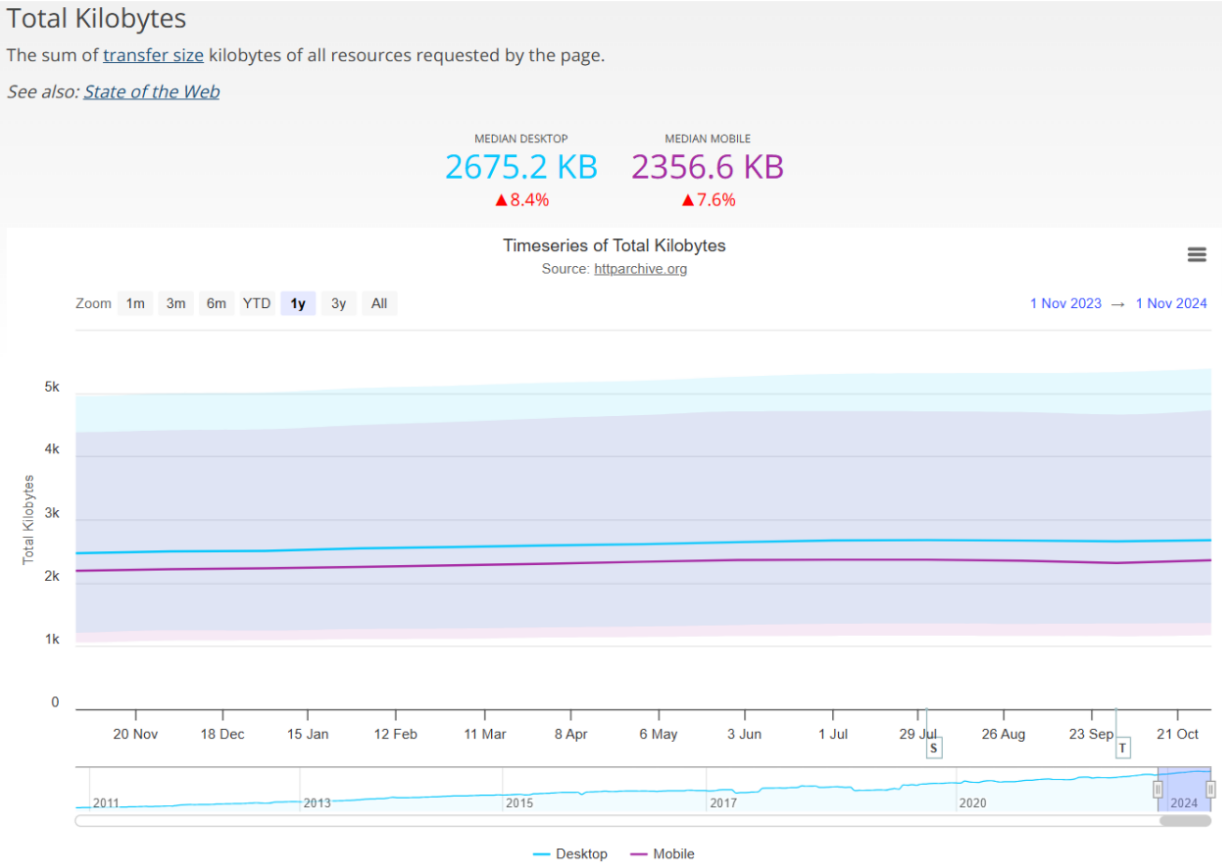
- Reducing the average size of a web page: Today, the average size of a digital interface on a desktop computer is 2.6 MB, an 8% increase from the previous year [4]. This digital bloat is not without consequences.
By optimizing their websites, companies have a real opportunity to reduce their carbon footprint while improving the efficiency and performance of their digital interfaces.
[4] Changes in the average size of a site from November 2023 to November 2024
♾️Choose a cloud platform focused on sustainability
Data centers have a very high carbon footprint, but choosing a green hosting provider can make a difference.
- Renewable Resources:
Choose accommodations powered 100% by renewable energy to help reduce CO2e emissions.
- The Geographical Challenge of Proximity:
The distance between the server and the end user affects the energy consumption associated with data transfer. Reducing this distance can lower the carbon footprint.
-Certified Data Centers ISO 14001 certification for a data center attests to its commitment to adopting environmentally responsible practices and minimizing its environmental impact. This involves implementing a rigorous environmental management system (EMS) aimed, in particular, at reducing energy consumption, improving waste management, and optimizing resource use.
💚Awareness and Engagement
- Train technical teams to incorporate eco-design
A team trained in ethical web development practices can significantly reduce the environmental impact of a digital project.
By adjusting their work practices (code optimization, file compression, minimalist design), developers can reduce a website's footprint.
- Offset residual emissions
Despite efforts to optimize, some emissions are unavoidable. Carbon offsetting helps neutralize this impact by investing in environmental projects such as reforestation, funding renewable energy, or protecting ecosystems. This approach is both responsible and affordable, with an average cost of 4.6 € per metric ton of CO₂e for a carbon credit sold.
However, to obtain a low-carbon-certified credit, the cost is €31.8 per metric ton of CO₂e.
As such, the digital sector—which currently accounts for 4% of global CO₂e emissions—is a key driver of the low-carbon transition. Calculating your website’s GHG footprint is an essential first step toward reducing your carbon footprint while optimizing your performance and CSR image.
With Decarbo’Solution®, enjoy personalized support:
- Measure the impact of your digital activities with a GHG assessment that complies with industry standards.
- Reduce your environmental footprint with practical and effective solutions.
- Offset your remaining emissions by supporting certified projects that promote sustainability.
Don't just be spectators—become agents of change. Together, let's build a digital future that's up to the challenge of climate change. 🌱
Take action now to build a sustainable future.